Following my approach to speed testing and taking heed from the warning that using FileMaker to measure FileMaker’s speed influences the measurement, it is time for a first exploration and to establish a baseline. This post will look into the results of testing how much time it takes to measure nothing. For those interested in the actual files, see this zip.
Those readers who are not or not immediately interested in the details of the test method can skip to the Results or Conclusions section.
1 Method
In brief, the method used is as follows
- Create an empty file
- Insert a test script
- Create clones and run them one by one
- Harvest the data through the data viewer
1.1 Create an empty file
The idea is that any unnecessary ‘thing’ ( for lack of a better word ) in the database could be influencing the baseline measurement. So it should contain as little as possible. For this, the following steps were performed.
- Use the ‘Create new …’ menu item and select ‘blank’.
- Then delete the default table and remove it from the relationships.
Inspection of the DDR or XML export of the design shows that there still are quite a lot of ‘things’ in the database. In terms of text volume in the XML, most is taken up by the CSS for the Apex Blue theme, ie the default theme used for the newly created blank file. It can not be deleted since it is used by the one layout in the file. The one layout can not be deleted, so one is stuck with at least one theme. Many elements in the theme can be deleted, but that idea occurred to me too late. The baseline test reported here and many subsequent tests were based on the empty file as described above.
As far as I tried, besides a number of styles, no other ‘things’ can be deleted from the newly created blank file. This makes sense, but that is another issue.
1.2 Insert a test script
Insert the following script, called minimal_speed_test

Notes about this script:
• The script is deliberately kept as simple as possible, in order to reduce the potential influence of the script on the measurements that it performs. One price to pay for that is that running one test run and harvesting its data requires manual work. This in turn means that it will not be suitable for executing large numbers of test runs.
• This script could be written as a calculation and create the same output, namely the $$progress_log variable. The calculation could be created and run in the data viewer, which would save an unnecessary ‘thing’ from the file. It probably would also result in a lower baseline than reported here.
However, eventually, one wishes to test calculations, scripts, user actions and other events. Whereas a test script can test calculations and scripts, a test calculation can test calculations but not scripts because it can not trigger a script. Admittedly, the duration of some events ( for example a calculation buried in an auto-update calculation ) and perhaps some user actions can not be measured with a script, or can be measured more accurately with a calculation.
The reason, I opted for a script is that at a later stage, I wanted to store measurements in records, rather than a global variable. I reasoned that for high volume tests, measurements might not fit in a global variable anymore. Variables can contain at most 10 million characters ( I believe, that is. The FM 2023 technical limits do not actually specify the character limitation, but I assume it is the same as for a field ).
• $max_loops takes its value from the file name ( that is the base name ) so that the very same script can be used to quickly generate tests for various test volumes. See also the next section about creating clones of the test file.
• It is not visible in the screen print above, but $$progress_log will contain a test run number which it copies from the last word from the file name
• Since the file is kept as small as possible, it does not process the test results any further, into records or a graph for example.
1.3 Create clones and run them one by one
To make sure that individual test runs are not influenced by previous runs, clones were made of the test file, one for each run. In fact, only one clone was made and then copied through the OS’s file system.
The easiest way to do this is to name the original file as follows: <any name> <x> For example baseline_test_v1 50000 In MacOS, duplicating a file with this name will result in baseline_test_v1 50000 copy. Add ‘ 1’ and continue duplicating. Subsequent files with names baseline_test_v1 50000 copy 2, baseline_test_v1 50000 copy 3, etc. will be produced.
Notice that <x> in the filename will be the number of times that the script will repeat its loop. It has to be the third word from the right in the base name. The copy number provides the test run number.
The individual files were opened, ran ( and the data harvested ) and closed through quitting FileMaker. Opening and closing files should be enough to clear any caches in FileMaker. Opening and quitting the app makes double sure, although I know of no indication that that is really necessary.
Note that I used the checklist from my approach to speed testing to remove possible external influences before running the tests.
1.4 Harvest the data
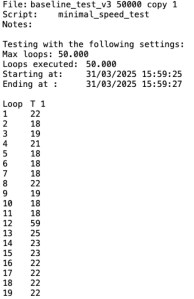
After a test run, the $$progress_log looks like the image to the right. It is a tab-separated two column table. The first column contains only labels. Notice that the second column just above the measurements contains the label ‘T 1’, with ‘1’ being the last word from the file name. The content of $$progress_log needs to be copied manually from the data viewer into a spreadsheet and there converted into a graph.
The first test result can simply be pasted into the top left corner of a spread sheet. Subsequent results can be copied in a separate scrap sheet, after which the second column can be copied to the first sheep. The result is a table that can then be processed further into a graph or pivot table. See the .ods file in the zip.
2 Results
For no other reason than time limitation, the minimal_speed_test was run 10 times following the method described in the previous chapter. Each run involved 50.000 loops and lasted about 2 seconds. The number of 50.000 was chosen somewhat arbitrary, but at least higher than 2000 based on provisional tests not reported here. Tests with higher loop counts will be presented in this blog at a later date. In line with the cautious approach set out in this post, first the result of just the first test run will be inspected in detail, before adding the results of the subsequent tests.
2.1 The first test run
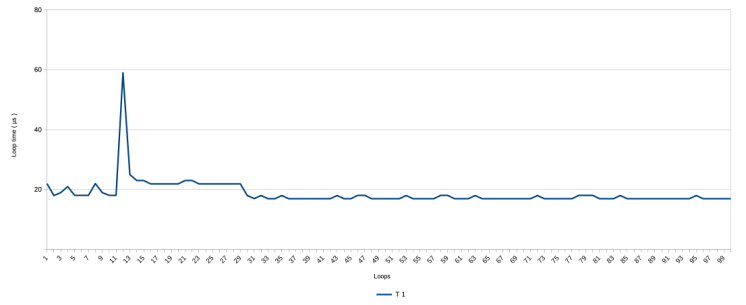
Below is the graph with the results of the first test run
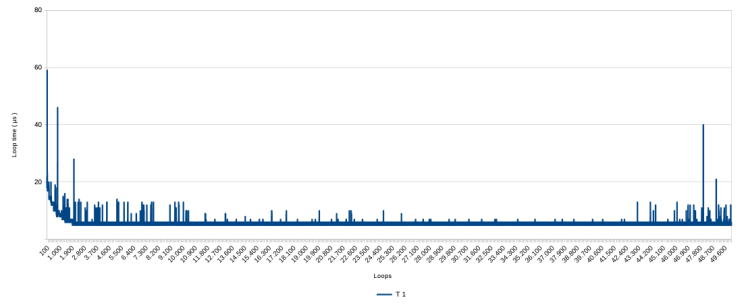
Three aspects stick out:
- the line is close to zero but not at zero. This has been discussed in a previous post. It is impossible to measure nothing, because the measuring influences the measurement. This is what that looks like. On average it takes about 6 or 7 micro seconds to get a measurement with this script.
- There are many spikes in the graph, going up to about 60 microseconds and unevenly distributed over the range.
- At the beginning, there is a first steep and than gradual decline in the measurements ( ie a speed improvement ) down from about 20 µs.
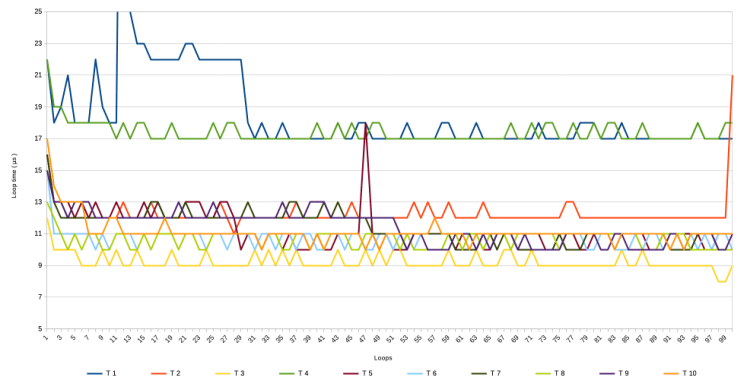
Step-wise zooming in on the first part of the graph produces the following
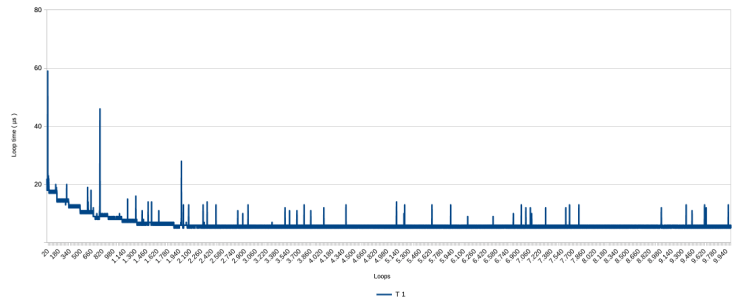
With this closer inspection, the gradual decline in measurements clearly is not gradual but happens step-wise, with a rough pattern of ever longer periods at a stable level. ‘Stable’ here means with a variation of 1 µs. The loop speed stabilizes completely after about 1900 to 2000 loops, at around 6 µs. The latter is not visible from the presented graphs, but is visible in the data.
The question here is, what is causing this decline and what is causing the spikes? Potential causes are FileMaker ( v. 2023 ), the Mac operating system (v. 13 / Ventura), and the hardware ( a MacBook Air M1 ). I lack the knowledge, but at the Vienna Calling 2025 conference, it was suggested that it is the hardware and/or the operating system, rather than FileMaker.
Some later reading up on how the MacOS works, suggested me that running the FM script asks continuous use of the microprocessor. This causes the system to dedicate more and more microprocessor time per turn in its scheduling system that it dedicates to the FileMaker process. The spikes could then be caused by higher priority interruptions from other processes.
This is all newbie guess work to at least make some sense of the graph. Perhaps it is more important for the understanding of what speed means in the context of FileMaker, to simply acknowledge that these patterns of spikes and the gradual shortening of loop times occur. Would the same patterns occur when the test is repeated?
2.2 Additional test runs
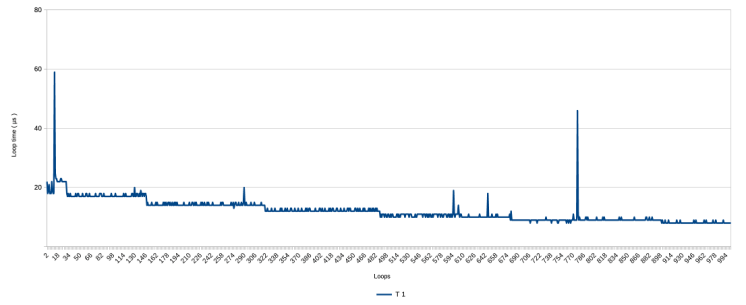
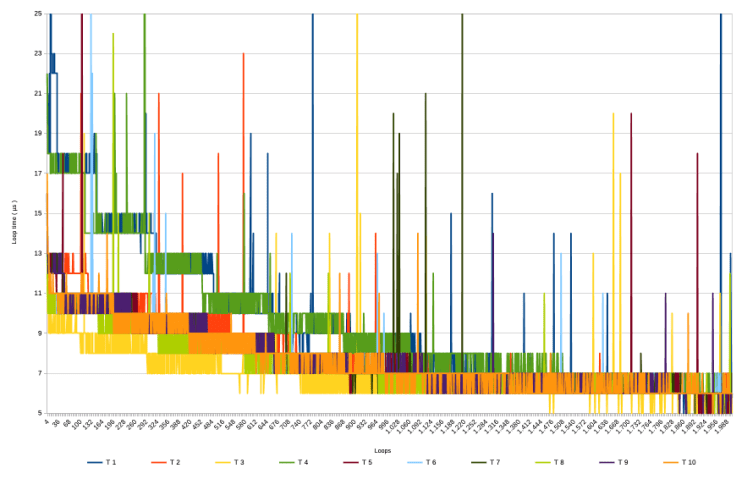
Without further ado, these are the overall graph and zoomed-in version of all 10 test runs.
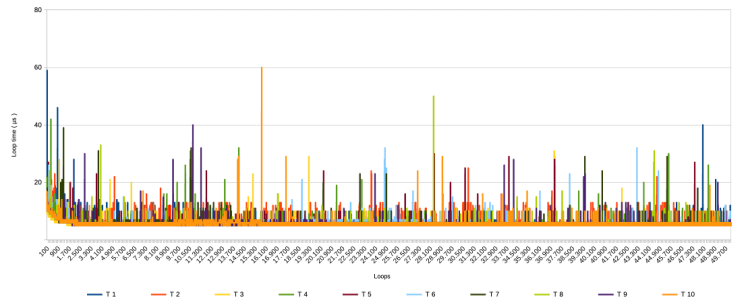
It should be noted that T 1 was run on March 31st 2025, whereas the other 9 were run on April 1st ( no fooling intended ) between 10:45 and 11:05 AM.
The following can be observed,
- All test runs show spikes, but the patterns vary between them. It seems that the distribution of the higher spikes in T 1 ( with most in the first and last 10.000 loops ) was a coincidence.
- All test runs show a similar pattern as T 1 with a gradual speeding up during the first 2000 loops
- The last and second last graph seem to suggest that, setting aside the spikes, there is a grouping visible in how measurements in the various runs decline. T 1 and T 4 ( green and blue ) seem to follow a similar pattern, so do T 2 and T 7 and T 9 ( bright orange, dark green and purple), and so do T 5, T 6 , T 8 and T 10 ( egg plant purple, light blue, lime and orange ), whereas T 3 ( yellow ) seems to follow it’s own very low path.
There are only ten runs, so all this remains conjecture. However, it is perhaps no spoiler to reveal that other tests ( to be discussed in future posts ) all do show the spikes and the gradual speed improvement at the start. When it comes to the 3rd point, I only noticed it while writing this post and having another look at the graphs.
3 Conclusions
This post described an initial baseline speed measurement script for FileMaker. It is a baseline script that tries to measure nothing, and it is an initial script because it is as minimalist as possible in order to reduce the script’s effect on the measurements.
The most important findings are
1) that during the first 2000 loops, the measurements decline, that is, speed increases, from around 15 µs to around 6, and
2) that spikes of various length occur at irregular intervals.
The findings are preliminary because only 10 runs were done due to the minimalist nature of the script which requires manual work to launch each run and collect the data.
It was attempted to make the test file as empty as possible to prevent as much potential unexpected influence as possible. It is now somewhat clear what kind of results that delivers, so the script and the file can and will be further developed in line with the cautionary approach set out in an earlier post. Such expansion is also necessary. After all, any speed testing facility cannot require an empty file because it will be used to measure speed within an existing database.
Clone files were used to make sure that different tests were running in isolation from each other. Just like the manual collection of the measurement data, it is a laborious approach. The use of clone files also is part of the cautionary approach that starts with simple measurements. In future expansion of the speed test facility, it would be better to not use one clone per run. With an eye on use of the speed test facility on production databases, using clones would not only be impractical but unrealistic. Production databases are full of data.
Finally, it is said that FileMaker slows down while processing long running scripts. The baseline test reported here does not confirm that behavior. It only shows a speeding up at the start. However, the test was aimed to measure no processing at all, and even though it measured something, it was not a particularly long running test: the average duration was about 2 seconds. The following posts will report on longer running baseline tests.
September 2025, Frank van der Most
