This post is about how a Pause step can delay a script in FileMaker much much longer than the actual step takes to execute. As I reported in the previous blog post, it messed up the baseline tests with v3 of a script that I am developing to measure how fast FileMaker works. This post shows how that happened and provides a hypothesis about why it happened.
The Introduction section will explain what the Pause script step is, how it is used in v3 of the script and what happened when the script was tested. One can skip the introduction if one is a FileMaker developer and has read the three previous posts ( v1, v2 and v3 ).
The Introduction will be followed by: Method, Results and Conclusions. The v4 script and the results reported in this post can be found in this zip.
Introduction
The Pause step and its use to refresh a window
FileMaker’s script language includes a Pause step. It temporarily halts the execution of the script, either until something else in FileMaker happens that causes the script to resume, or until a certain amount of time has passed. Every FileMaker developer will use it sooner or later.
One particular application of the Pause step is to make sure that the user sees the effects of the Refresh Window script step, which … uh … refreshes the window. Except that it does not in many situations. Somehow the refresh does not reach the display, i.e. for the user to see, before FileMaker moves on to the next step and the refresh somehow seems have gotten lost. It is a glitch or an error in my opinion. The workaround is to add a Pause step directly after the Refresh Window step. The Pause step can be set to an almost non-existent amount of time for the refresh to be visible to the user. Even a millionth of a second suffices and I am not sure if FileMaker can even wait such a short time.
FileMaker also has the Refresh Object script step, which in my experience has the same downside as Refresh Window, and the same workaround
The Pause step in v3 of the speed measuring script
Users usually require that when some process lasts long, they are somehow updated about its progress. In FileMaker, using the native possibilities ( i.e. no plugins ), there is no way around using a refresh script step to occasionally update the user. So, I used it also in v3 of the speed measuring script. Version 1 did not provide a progress update because it was meant to be as minimalist as possible. V2 also did not have a progress indicator, but the tests could not practically be continued beyond about 5 million loops. 5 Million loops took about 3 minutes to execute, which would be stretching the patience of most users and developers. 50 Million loops would take about half an hour. Virtually no one would be willing to sit that out without progress updates.
What happened with v3?
Read the previous post for a full report, but it boiled down to it that v3 could not reproduce the same baseline results ( with 50.000 loops ) as v1, whereas executing 50M loops did produce expected results.
More in detail: just as v2, v3 does not measure individual loop times, but calculates the average loop time at the end of a ‘lap’ of several loops. Both the number of loops and the number of laps / the lap size can be set. v3 updates the progress indicator after each lap. To see if v3 could reproduce the results of v1 with 50.000 loops, v3 was run with 50.000 loops and a lap size of 1 loop. I call this a calibration test. The average loop time of v3’s calibration test is around 43 µs, whereas v1 and v2 resulted in around 6 µs. Also, the pattern that is visible in the results of v1 and v2 was not reproduced in v3.
When v3 was run with 50M loops split up in 50.000 laps ( so 1000 loops per lap ), the average loop time went down to around 7,8 µs. Still higher than the v1 test average, but more in line.
The results could not be further analyzed because v3 of the speed test script does not allow to analyze the individual loop times inside a lap. This is what v4 will solve. The following section explains the script in detail and the method of analysis.
Method
The same method to create files, run tests and collecting data was used as for the baseline script v1. V4 collects the average loop time per lap and reports it in the $$progress_log variable. It also collects the duration of individual loops, and stores them in a table. The script and the database will be discussed in more detail below.
Just as with v2 and v3, the script for v4 first was used to run a calibration test, a test that runs 50.000 laps that consist of 1 loop to confirm ( or not ) that the test creates similar results as v1. Because v4 is an adaptation of v3, it was expected not to pass the test and produce results similar to those of v3: a rather high loop average with relatively high volatility.
At the end of the post about v3, it was concluded that failing this test could be explained by the presence of the Pause script step which is executed once at the end of every lap to refresh the progress message to the user. The 50M loop ( in 50.000 laps of 1000 loops each ) test run of v3 produced results closer to previous tests, but still resulted in a 1/3rd higher average loop time than expected.
To explore the effect of the pause script step on the loop times, in this post’s tests, the script was tested several times, each test consisted of 10 runs, each of 50.000 loops, but with increasingly bigger laps of 10, 100, 1000, 10.000 and 50.000 loops respectively.
Baseline script v4 and the speed_tests table
Baseline script v4 was named laps_based_speed_test_with_progress_indicator and programmed as follows. The highlighted areas show the essential difference with the script that was used as v3.
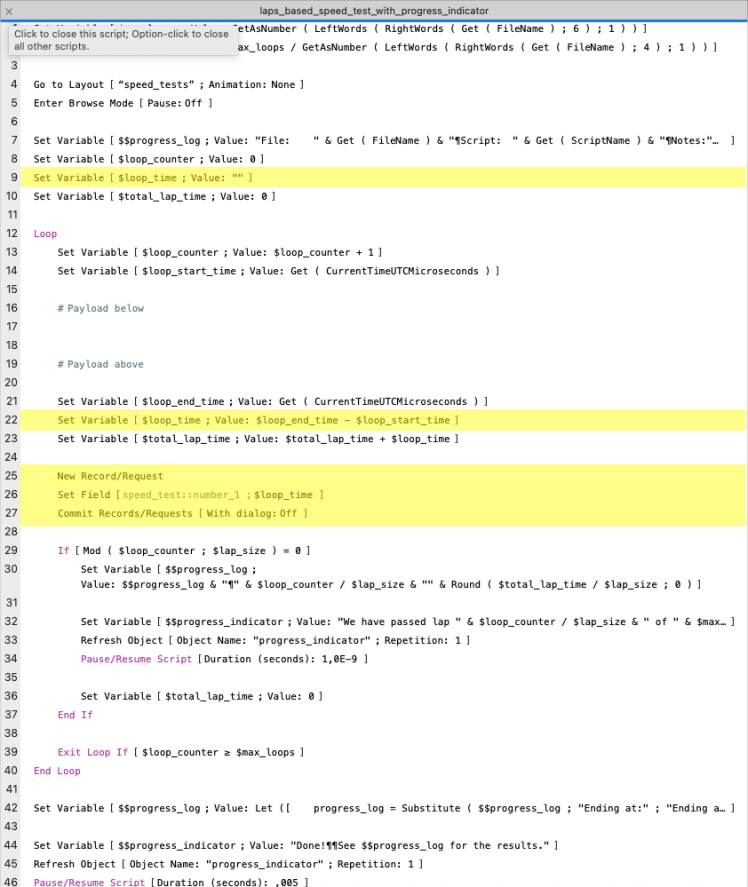
- Step 16 to 19. Notice that the payload lines are still empty, as with the previous versions of the script.
- Step 9 and 22. The script introduces the $loop_time variable to capture the $loop_time. Strictly speaking, it is not necessary, but it adds readability.
- Steps 25 to 27 create a new record in the speed_test table and store the loop time in a field.
Contrary to it’s predecessor test databases, v4 does contain a table which is called speed_test. It has exactly one field, number_1, which is an un-indexed number field with the language setting set to unicode.
As with it’s predecessor, the lap times need to be manually harvested from the $$progress_log variable with the help of the data viewer. The data viewer also needs to be used to harvest the loop times with an ExecuteSQL statement. After each test run both were collected and stored in a spreadsheet.
ExecuteSQL (
	"SELECT number_1 FROM speed_test"
	; "	" ; "¶"
)
A note on OS and hardware
The tests in the previous three posts were run on a MacBookAir M1 with MacOS 13, Ventura. The original tests that were run for this post however contained an inconsistency ( they did not measure ‘nothing’ but the time it took to add the record and set the field ) and had to be re-run. In between, the OS was upgraded to version 14 Sonoma.
That should suffice in terms of explaining the method of this post’s tests. However, if you have any questions or comments, please leave them at the bottom of this post or send me a direct message. The following chapter describes the results.
Results
The results will be presented in three parts. First the calibration test with 50.000 laps of 1 loop, and secondly, the series of tests with increasing lap sizes
Running 50.000 laps of 1 loop – calibration test
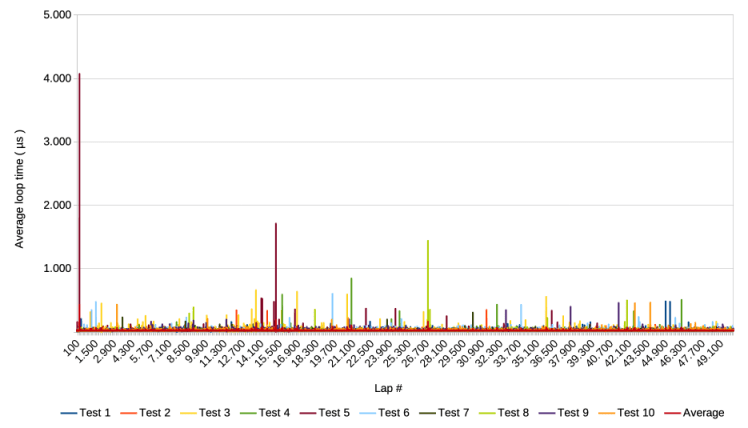
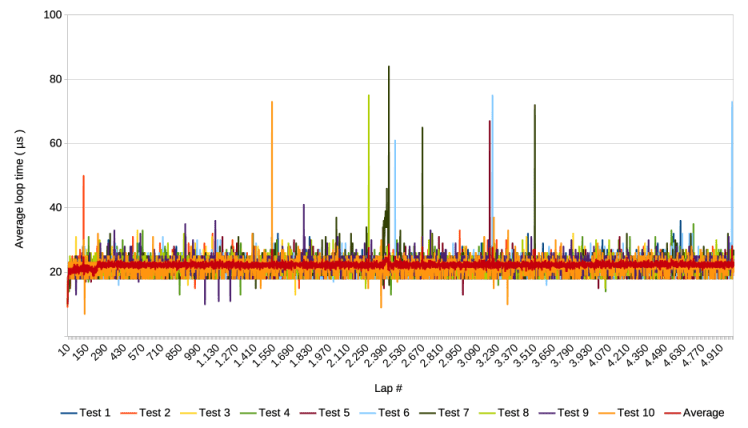
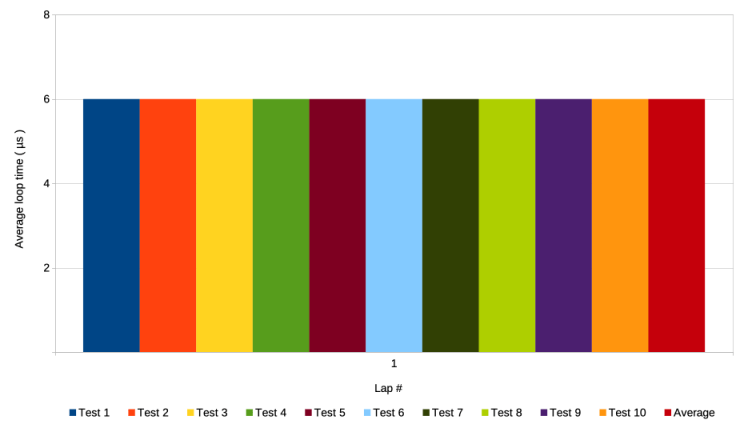
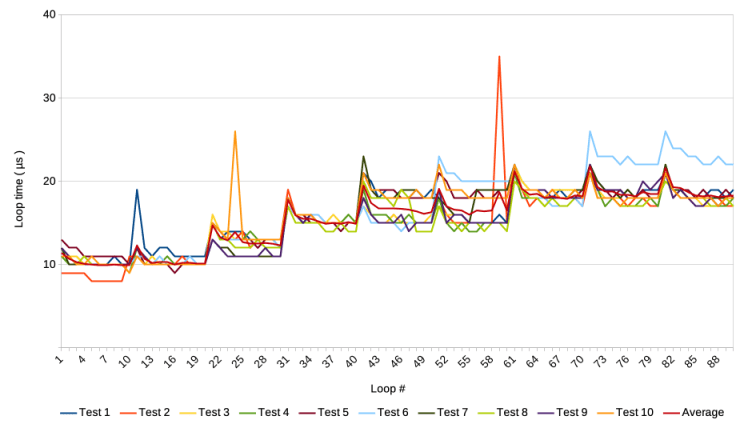
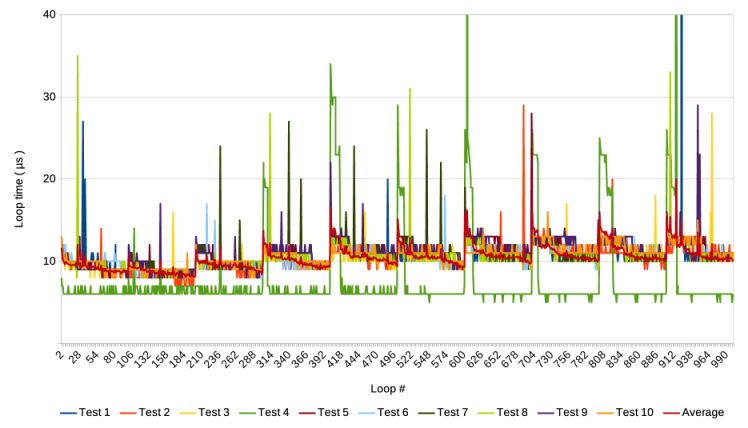
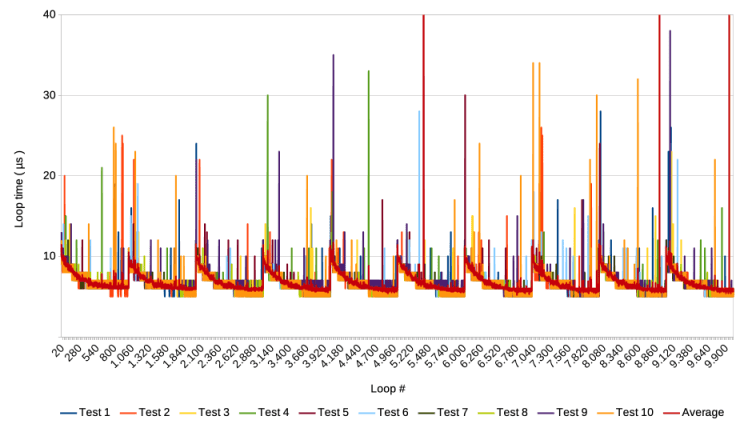
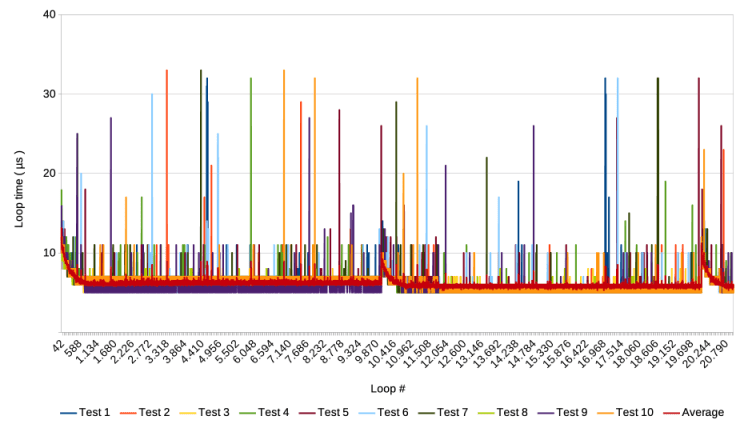
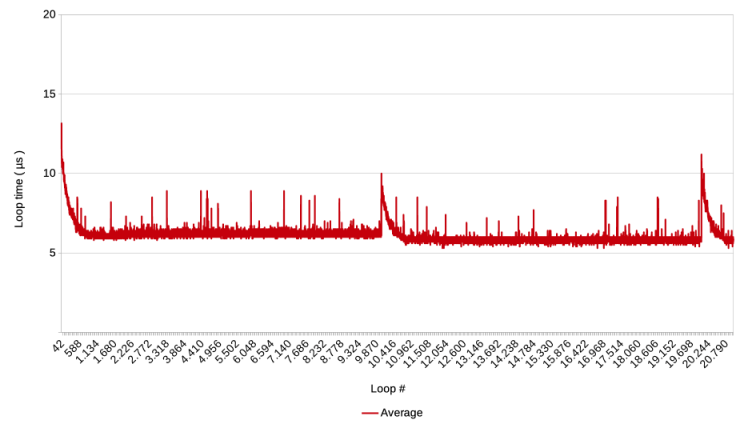
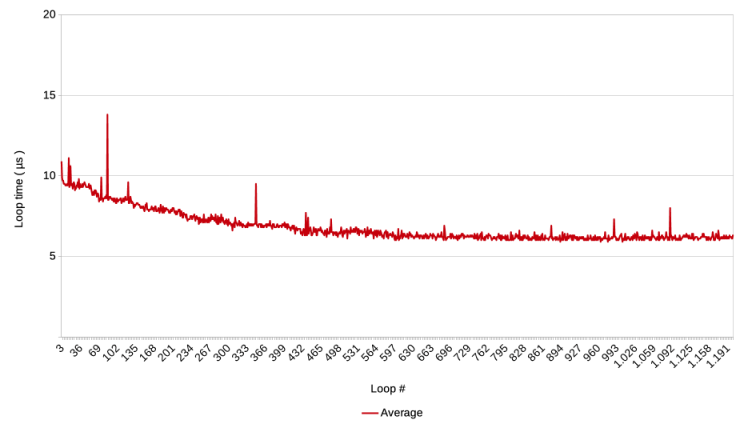
The following graphs show the results of 10 test runs, including an average of the 10 runs. Each of the 10 runs lasted about an hour.
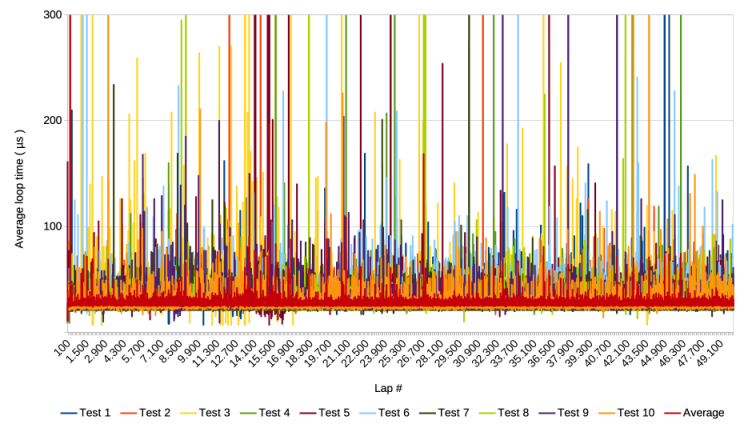
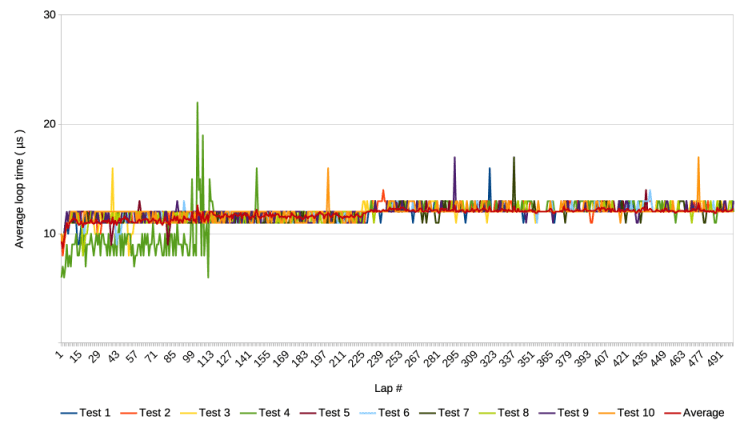
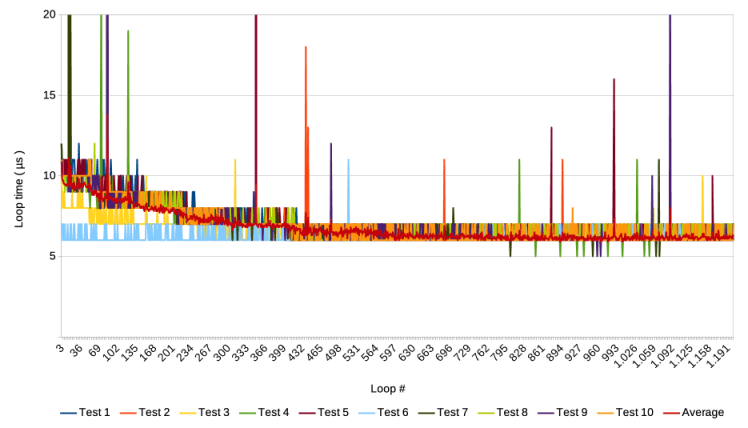
The following graph zooms in on the y-axis
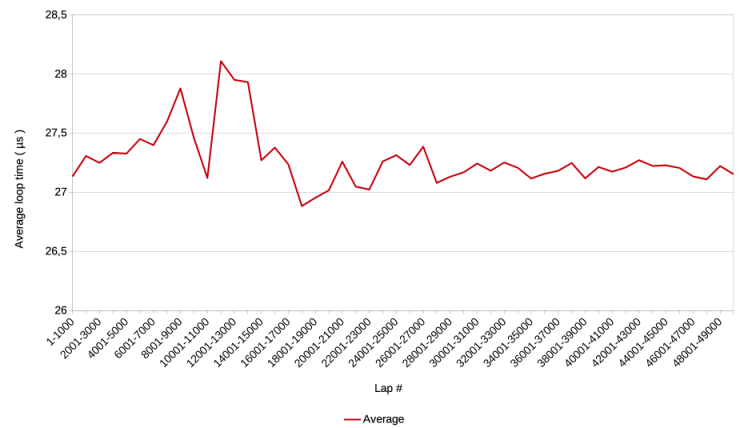
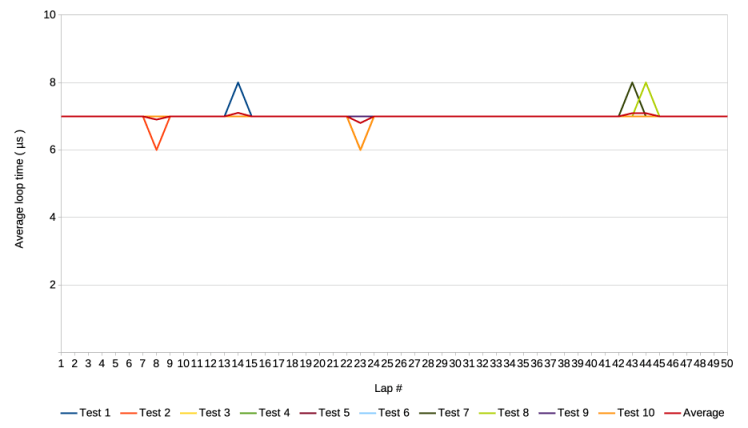
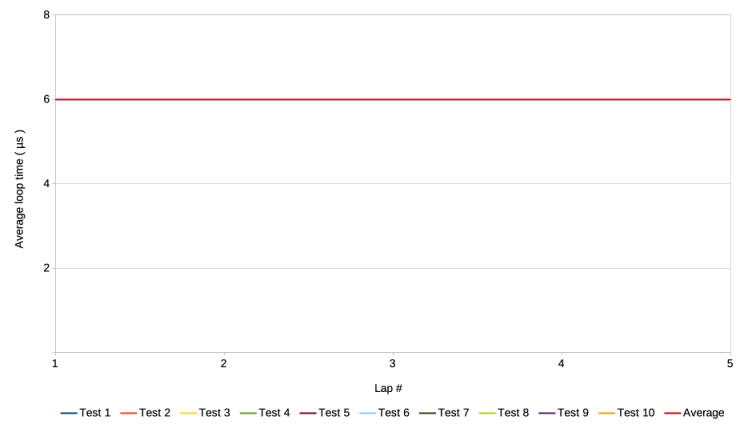
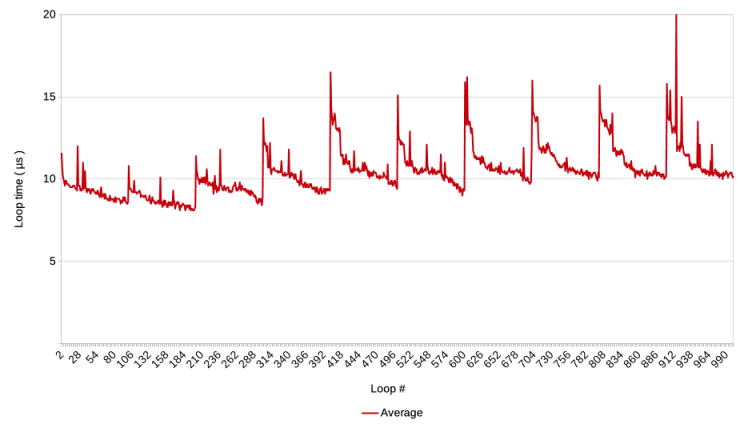
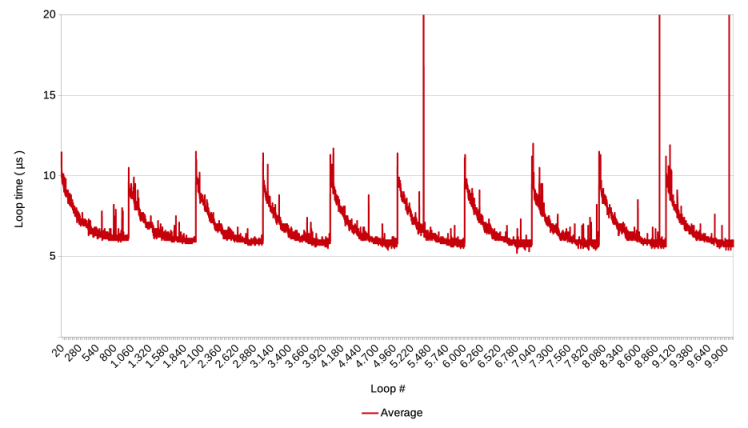
Lastly, the following graph shows average loop times over windows of 1.000 laps or loops
The results of the calibration tests show a similarly volatile pattern as those of v3, except that…
- v4 shows fewer spikes than v3, and the spikes are also lower, and
- the average loop time is markedly lower, about 27 µs compared of 43 µs of v3.
Even though the average loop time is lower than that of v3, it is still 4,5 times higher than the expected average of 6 µs of v1.
Running 50.000 loops with laps of various lengths
After the calibration test, 5 subsequent tests were performed. All performed 10 test runs of 50.000 loops, but each test split those 50.000 loops up in laps of different lengths. The results are provided in the matrix of graphs below. The columns represent the 5 tests, and each row shows a different graph of the test.
Row C is the most important row, because it reveals the pattern of what happens, each time the Pause script step is executed. More about that is presented below the matrix of graphs. The graphs in row C provide a sample of loops on the x-axis and the average of the 10 test runs. The loop samples are chosen to show an illustrative number of laps.
Row B shows the same as row C, but adds the graphs of the 10 test runs. Unfortunately, the legends of these graphs and the graphs of row A, mention ‘test’ instead of ‘test runs’. Apologies for the confusion.
Row A provides the overviews of all laps, all test runs and the average. The most important thing to observe is that from test 1 to 5 to volatility of the graphs diminishes, and the average loop time drops from around 20 µs to a steady 6 µs.
Note that the overview of laps for test 5 is a column bar graph instead of a line graph. This is because a line graph for one measurement makes no sense. Technically/mathematically speaking, all graphs should be bar graphs because the depicted values are individual values. The use of line graphs suggests a continuum in the measurements which does not exist in the real world of the test. However, line graphs were chosen anyway because of their higher readability in the context of these tests.
Click a graph to enlarge the image.
TEST 1
5000 laps of
10 loops
TEST 2
500 laps of
100 loops
TEST 3
50 laps of
1.000 loops
TEST 4
5 laps of
10.000 loops
TEST 5
1 lap of
50.000 loops
A)
Overview of laps
B)
Loop samples, test runs 1 to 10 and average
C)
Loop samples, average only

The graphs in row C, viewed from left to right, show an increasing level of detail per lap because the lap size increases.
Each graph starts with a spike or high point after which loop times gradually decrease.
Pause-triggered spikes
Then follows a series of similar spikes and decreasing loop times. These spikes occur at the loop right after the loop in which the pause script step was executed at the end of each lap. Except in the last graph of the row, which shows the results of a test with just one lap, so it can not show the spike after the first lap.
The graphs for tests 3 to 5 in row C show that it takes about 1.000 loops before the loop times drop back to the level that was reached at the end of the previous lap.
Lap-wise decrease
Close inspection of the graphs shows that the gradual decrease after a pause step, in some cases decreases a little below the end level of the previous step. However, this appears not very often. If the same would happen to subsequent laps, it could in principle lower the average loop time. However, the graphs of row A show that this does not happen, or at least not in a significant way.
Lap-wise increase
The graphs of tests 1 and 2 in row C show that the opposite happens more often: a lap finishes before the loop times have dropped back to the end level of the previous lap. This seems to ’cause’ the next spike to start higher. If this happens to subsequent laps, the average loop time increases, as can be seen in these two graphs. However, this lap-wise increase does not continue for ever. After about 5 laps, the effect dies out and the average loop time remains at the level that is then reached.
Conclusions
The spike at the beginning of each graph ( i.e. loop 1 ) is not caused by a pause script step but by the start of the script. In an earlier post it is discussed that this spike and the subsequent decline of loop times are likely due to the OS and/or the hardware which gradually make more processor time available to the FileMaker app.
What happens when a script pauses?
Based on the findings presented above, I would assume that the Pause script step causes a similar effect as the start of a script. The Pause step causes FileMaker to do very little for a while, which tells the OS that FM does not need a lot of processor power. After the pause is finished and FileMaker resumes running the loop, it initially does not get a lot of processor time, just as when the script started, but then gradually gets more time assigned and loop times decrease.
Put differently, the Pause step not only introduces a pause as intended, but it causes a execution slowdown long after it is finished. This goes against a basic premise that I at least have always held: if a script step takes a certain amount of time at one point in a script, the exact same step under the same circumstances takes the same amount of time elsewhere in the script. Apparently, the time it takes can be influenced by something completely unrelated that happened long ago. Even doing ‘nothing’ can last a lot longer.
Lap-wise increase
The lap-wise increase of loop times ( described at the very end of the Results section ) suggests that the OS ‘keeps track’ of how much processor time FileMaker had ( or put differently, how high of a priority FM was given ) just before each pause, and then takes that as the new base. After about five laps, that base is not further increased. The question of course is why? For the time being, I will leave this unanswered. If you do know, please leave a comment or send me a direct message.
The more interesting question is, are there circumstances ( that one can control with FileMaker ) under which the lap-wise increase does not level out but continues increasing, and could that explain why FileMaker gets slower during long running scripts? Without knowing exactly how the OS and hardware work, one might still be able to simply ‘shake the box’ and see what happens. It turns out that the lap-wise increase can indeed be ‘pumped’ up to much higher levels. This will be the topic of a next post.
Lap-wise decrease
A few lap-wise decreases were also observed. They remind of spikes followed by slight speed increases that were observed in previous tests ( see here and here ). Here too, I can not explain why this happens, but it would be useful to know if this effect can be exploited to make script faster. It is unfortunate that these decreases occur far less often, but one can always hope to stumble upon some insight later on.
Which other script steps cause the same effect?
In these tests the speed changes are triggered by the Pause script step. In long running scripts and scripts that need to execute fast, it makes no sense to frequently have a pause. However, there may be other script steps that trigger a similar effect. Future testing will tell, but candidates would be script steps that also somehow release FM claim to processing power, like steps that interact with the operating system and steps that involve waiting for a server to respond.
Frank van der Most, 24 October 2025
PS It has always puzzled me that it does not matter how long the pause is that causes a refresh of a window to become visible to the user. The above suggests an explanation: the pause causes a decrease in the priority that the OS gives to FM and allows it to prioritize window management of the FM window. Or perhaps FM has an internal prioritization mechanism to the same effect.
