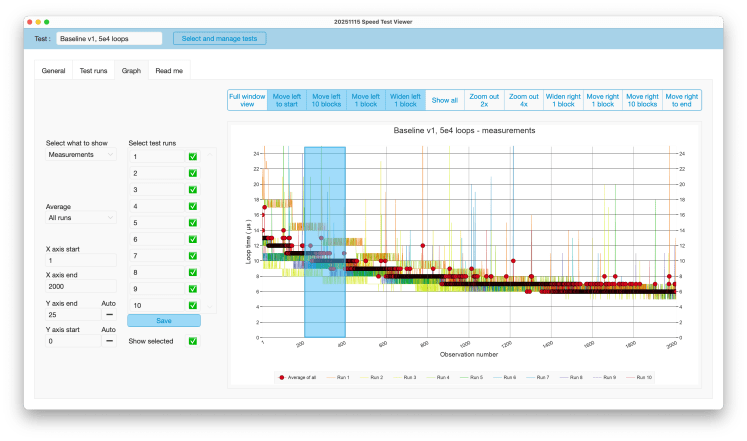
In my posts over the past two months, I alluded a couple of times to features of a future test facility for FileMaker solutions. That facility is still under construction. However, it includes a graph viewer to visually explore test data. A demonstrable version is now ready for publication. It is poetically called Speed Test Viewer. Here is a screenshot of its main screen. ( Click to enlarge )
The Speed Test Viewer can be downloaded for free from its product page, which also includes a manual and background information. A file with demo data is available below.
If you are using it or trying it out then please do let me know your questions and especially your feedback!
How is the tool useful for speed testing?
Saves import, export and management
The test data is generated by FileMaker and delivered in FileMaker. Long running tests can easily result in thousands to millions of measurements. It saves export and import times and later data management when the data can also be inspected in FileMaker.
Easily accessing detail and overview
During my explorations I had changing needs for detail and overview and had to adjust my scripts. From individual loop times to window averages ( covering multiple loops ) and averages between different test runs. Then, when I notices something puzzling, I needed to unpack these averages again. This tool allows one to do that on the fly by selecting which level of detail one wants to see: individual measurements, individual test runs, averages between test runs, or window averages over series of measurements. This all happens through the settings left of the graph.
Easily navigating a big graph
What goes for the data ( needing to go from loop times to averages and back ), in a way also goes for the graph. Even when data is summarized, there may still be thousands or millions of data points to visually inspect. They simply don’t fit on a regular display. This tool also makes it easy to move around through the graph. Zooming in and out and moving left and right to see different stretches is made possible through the buttons above and over the graph.
Take it for a spin
The download mentioned above contains no demo data, but here is the same file with the data that I published in the past months. To demonstrate the solution’s possibilities most tests are set up with different graph settings. Feel free to play around. Use ‘Select and manage tests’ to select a different set or use FM’s native record navigation options. For more instructions see its product page.
Frank van der Most, 20 November 2025
