FileMaker’s Insert from URL script step, and at least four more script steps, appear to trigger what I am calling ‘speed bumps’: temporary drops in performance after their execution. Besides graphs to demonstrate the pattern, previous posts did not go into the numerical part. This post will address how how big the total delay is and how long the speed bump lasts in situations where the speed bump effect is allowed die out.
Method
First off, I need to apologize for badly naming the Y-axis in the graphs in the previous posts. They mention ‘loop time’ but the measurements displayed do not show the loop time but the ‘payload time’. The payload in the test scripts is the part of the loop that is measured. Which was empty during those tests. The reason for that was to establish a base line. I wanted to know how long it takes to ‘do nothing’, so that we know something about the influence of the act of measuring. I am writing ‘do nothing’ with quotes because, the measuring does cost time, so it is impossible to measure how long doing nothing takes.
When I discovered the speed bump effect, and investigated it more, it made sense to continue measuring ‘doing nothing’ because a baseline for that was established. The graphs in previous posts depicted the number loops that were executed. It varies somewhat, but the speed bumps died out in about 1000 to 1500 loops. Now that the focus shifts to quantifying, this does not suffice anymore.
The working hypothesis is that the speed bump is caused by the OS, not by FileMaker. The idea is that the speed bumps occur because FM somehow indicates to the OS that it is in a wait state or at least is using less processor time. The OS responds by assigning less time ( for example, fewer or smaller time slices in a Round-Robin system ) to FM. This lasts until it notices that FM finishes the wait and continues needing processor time again. It then gradually assigns more time.
Hence, to establish how long the speed bump lasts in micros seconds, the duration of the entire loop is needed. However, the duration of the speed bump trigger event itself should be excluded.
The same method was used to create a test file, run it multiple times and harvest the data as in Baseline script v1. However, a different script was used, which will be discussed below, and the file was not empty, as will also be discussed below.
loops_based_speed_test_with_progress_indicator_v2 script and the speed_test table
The script looks as follows and is quite similar to the earlier baseline scripts.
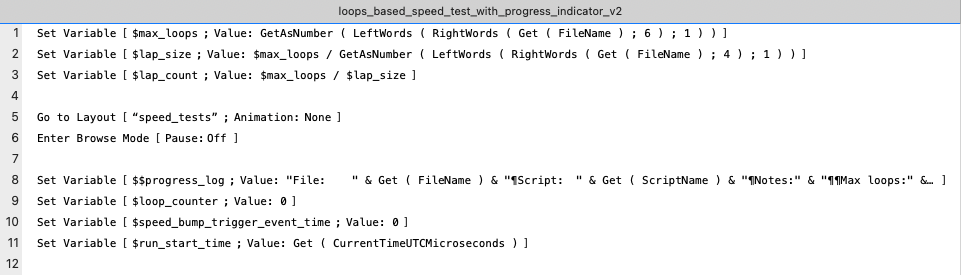

- Line 1 to 11
These lines initiate variables and make sure that the right layout is selected and that FM is in browse mode.
The number of loops to execute and the number of laps for progress updating are extracted from the file name, so that no changes to the script need to be made for different test settings.
No records are deleted, but it is assumed that the file has no records at the start of the script. This is assured through the method set out in Baseline script v1.
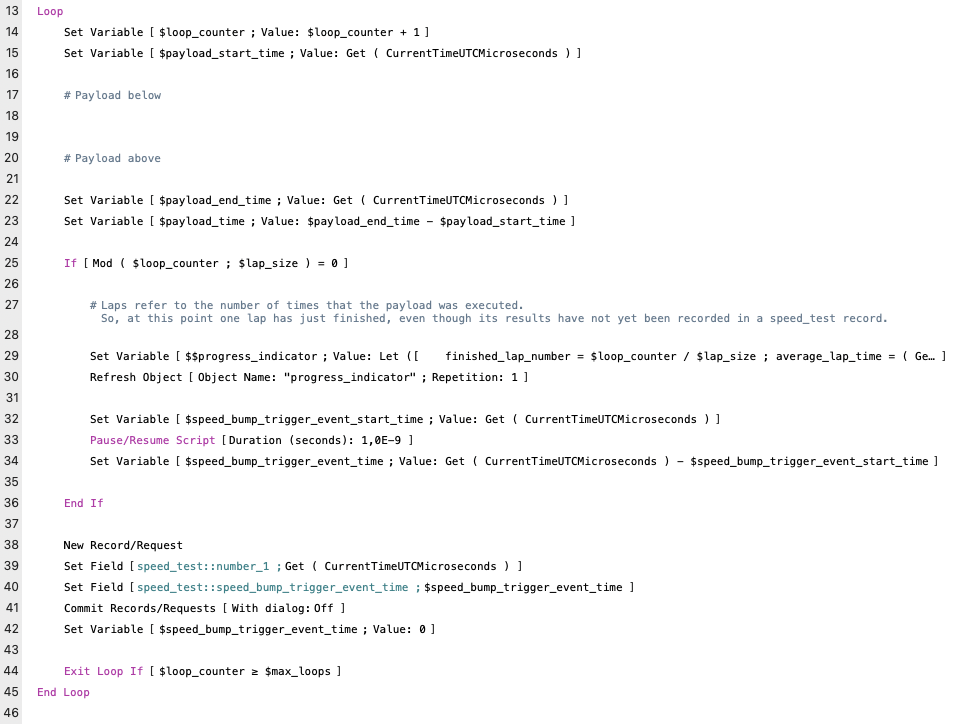
- Line 13 to 45
Contains the test loop, including its payload, progress updates and management of the measurement data.
- Line 15 to 23
The payload is placed here, and the duration of the payload is measured. As explained above, the payload remains empty, and in the current test, its measurement is actually not stored or otherwise collected.
- Line 25 to 36
This block takes care of updating the progress message to the user, which is delivered through the $$progress_indicator variable.
The updating requires a Pause script step, which triggers the speed bump behavior. For the current test, the duration of the Pause itself needs to be excluded from measurements, which is why it is captured in the variable $speed_bump_trigger_event_time.
- Line 38 to 42
These lines store the timestamp in micro seconds in field number_1 ( which in previous tests would hold the payload time ) and the duration of the pause event in speed_bump_trigger_event_time .
Instead of calculating the loop time, the current time in micro second is recorded and loop duration calculated afterwards. This way one also does not need to worry, if and how the calculation of the loop time will affect ( or not ) the calculated value.
- Line 47 to 53
Rounding off and updating the progress message to the user.
Besides the two number fields that are referenced in the script, the speed_test table also contains the unstored calculation field loop_time, which calculates the loop time as follows:
Case (

	Get ( RecordNumber ) ≠ 1 ;

		number_1

		- GetNthRecord ( number_1 ; Get ( RecordNumber ) - 1 )

		- speed_bump_trigger_event_time ;

	""

)
After running the test, it appeared that also the unstored calculation field record_number was needed. So it was added afterwards with the calculation ‘Get ( RecordNumber )’.
With this script and these fields, the tests could be run actual loop times calculated and the duration and size of the speed bumps calculated. The exact calculations will be described in the following chapter.
Results
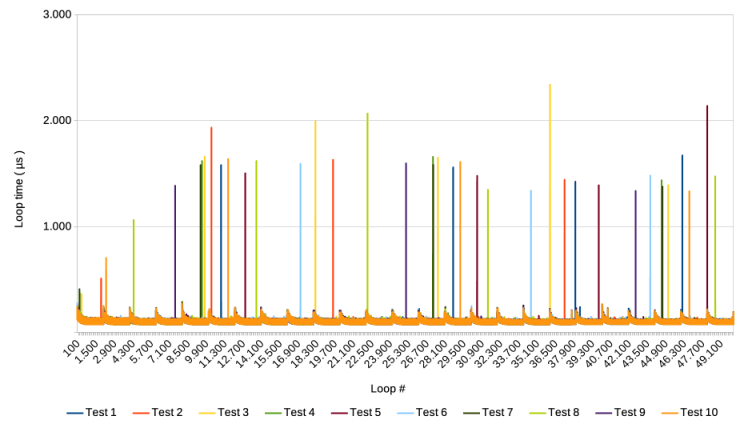
Running the script with 50.000 loops divided over 25 laps gives the following familiar result
Zooming in on the loop 2000 to 6000 ( lap 2 and 3 ), and adding the average, provides the following
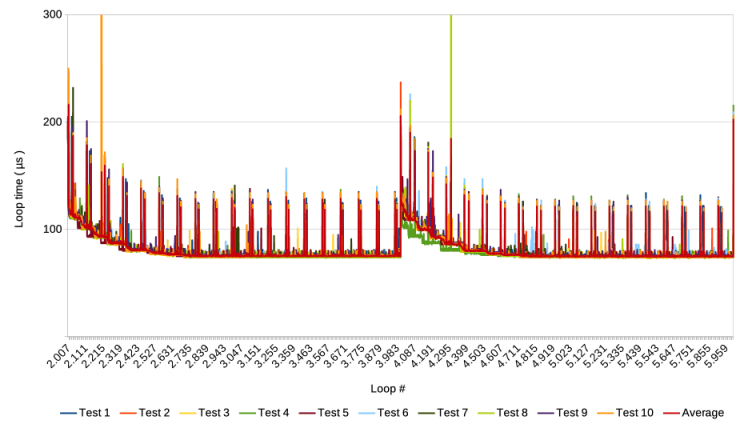
Note that the test was run with FMP 19 on a MacBook Air M1, with MacOS Sonoma ( 18.4.2 )
Download the data for this post and a clone of the test file here.
Speed bump size
To calculate the size of the speed bump, I only used the average of the 10 test runs. To calculate the size of the speed bump, for each lap, one needs to calculate the difference between the average curve and the base level of each lap. The base level of each lap is taken to be the average of the second part of each lap where is is clear that the effect of the speed bump has died out. This is depicted for loops 2000 to 6000, in the following graph
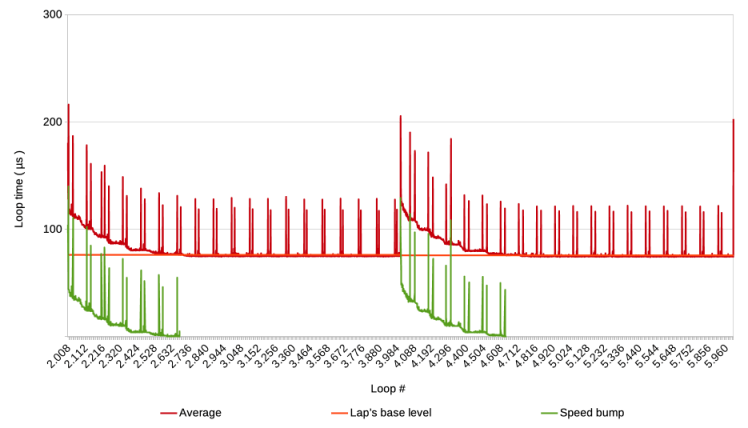
The surface underneath the green ‘Speed bump’ line is the duration of the speed bump, i.e. the extra time that the Pause step costed after it was performed. As cut-off point for the speed bump, the point was taken where the Average line would cross the ‘Lap’s base level’ for the first time. This point varies somewhat from lap to lap.
To calculate the surface underneath the green ‘Speed bump’ line, one can simply add the values. When this is done for all laps, the following graph is the result.
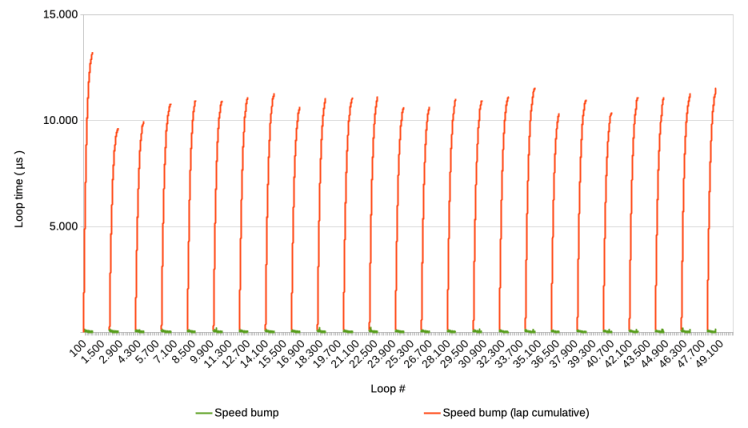
Notice that the first speed bump is not caused by the pause step, but by the start of the script, so the first orange peak should not be taken into account. So, speed bumps add about 10.000 to 11.000 micro seconds to the base level. That is, if the Pause step would not have been executed ( nor any other speed bump triggering step ).
Speed bump duration
The next question is, how long does it last before the effect dies out. To answer this question, the cut-off point of each lap was looked up in the spread sheet, and its time stamp looked up in the FM files for the 10 test runs. Next the time stamp of the start of each lap was looked up and the two subtracted. The differences were then plotted in the graph below. See the sheets ‘Lap start, time stamp’, ‘Base level reached, time stamp’ and ‘Base level reached, µs’ in the spread sheet. This does not provide the exact data, because the cut-off points were established for the average, whereas the time stamps were looked up in the 10 test runs. However, it should give a reasonable approximation.
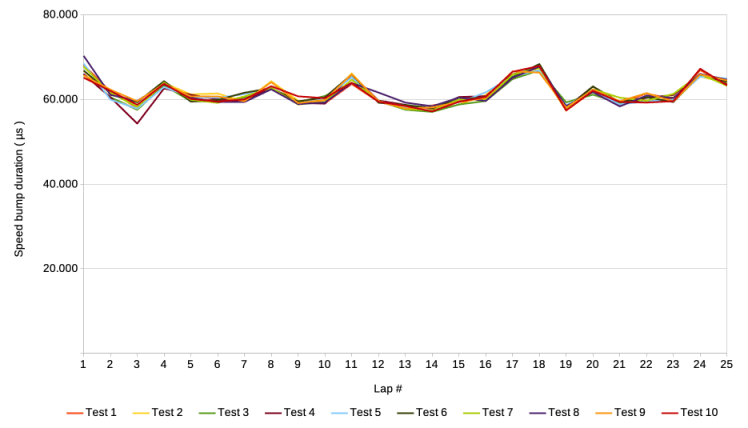
Again excepting the first lap, the duration of a speed bump is about 60.000 to 70.000 micro seconds, i.e. 60 to 70 milliseconds. Perhaps the most interesting is that the pattern of the subsequent laps is virtually the same for the individual test runs, even though they were run with a minute or two in between.
Conclusion
Summing up the results, a speed bump takes about 60 to 70 milliseconds to die out, and during that time, ‘looses’ 10 to 11 milliseconds in processing time compared to the situation without the Pause step triggering a speed bump.
Loosing 1 amount of time on 6 to 7 seems a big deal, but the amount of damage of course depends on how often a script step is repeated that causes a speed bump. If such a step occurs only every 20 seconds, then the loss of 10 milliseconds is virtually nothing.
On the other hand, what would happen if the next speed bump is triggered before the previous one died out? During previous tests, we have encountered this a few times. For example, here is a graph showing the average of ten test runs in which a Pause step was executed every 10 loops instead of every 2000.

It seems that the base level is pushed upwards with every next lap for about 5 times, after which it stabilizes at a level almost twice as high as at the first 10 loops. This begs further investigation, including further hacking. Are there circumstances under which the base level can escalate even further?
Frank van der Most, 11 December 2025
