1 What does it do for whom?
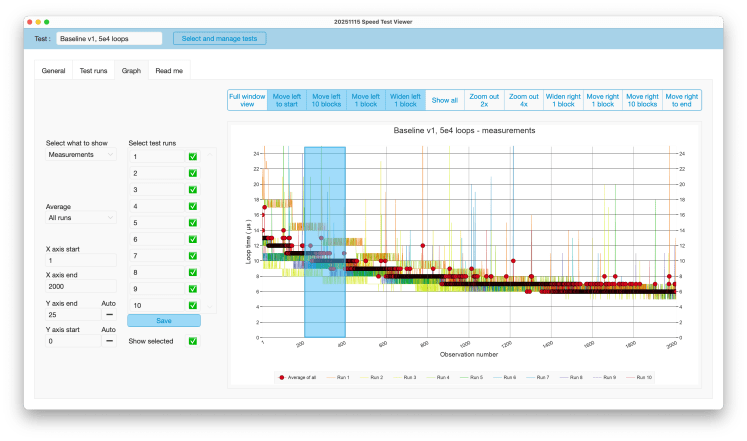
The Speed Test Viewer is a FileMaker solution that helps developers visually exploring data series resulting from speed tests.
The image should say more than a thousand words. Click it to view it in full image size. This works for all images in this post.
2 Why does one need it?
For the tests that I reported on in earlier posts, I generated test data, copy-pasted it into a spreadsheet and generated and explored graphs. Having the graphs in the place where the data is generated saves work and waiting. Secondly, zooming in and out and moving around in a graph in a spreadsheet is cumbersome. This solution makes that easy.
3 Where to get the solution file?
Download version 20251115 here – for free. Feel free to use it as you see fit, but see the copyright section below.
4 Conceptual design
The solution distinguishes between tests, test runs and measurements. A graph depicts data from one test and can show at most 10 test runs and an average. A test can have more than 10 test runs, and one can select which ones to see in the graph.
The idea is that test runs and their measurements are the results of repeatedly running the same speed/duration test in a FM application that needs improvement. Hence the graph is a multi line graph, and allows the depiction of averages and window averages.
Even though the line graph may suggest it is a timeline or a continuum, it is not. It is merely visualizing the individual measurements in what to me seems the most practical way for visual inspection. Mathematically speaking, it should show a multi column graph.
One can also imagine that each test run measures the respective duration of a different part of the same test, for example different parts of a script. In such a use case, one may prefer to stack measurements into a stacked line graph or stacked column graph. This is not supported in the UI of the current version, but can be tweaked by changing the graph control’s chart type setting and adjusting the calculation for automatically setting the Y axis start and end.
5 How does it work?
Hopefully all buttons speak for themselves, but here are some pointers.
5.1 Entering data
To create a test, add test runs, and populate with measurements :
- Click ‘Select and manage tests’ and then ‘Add a test’
- Enter a name in the top left corner of the layout
- In the ‘General’ tab, enter values for ‘Measurement quantity’ and ‘Measurement unit’. These are used to label the Y axis.
- In the ‘Test runs’ tab, use the ‘Add test run’ button to add as many test runs as needed.
Test runs are automatically numbered but one can override these with alternate names or numbers. This will not lead to a change in the test run’s position in the list. The ( overridden ) names will be used in the graph’s legend.
- Use the ‘Import test data’ button to import measurements into each test run.
In the graph, measurements will be shown in order of creation / import.
Start date / time and end date / time will reflect the import action, but can be changed manually to reflect the actual test.
Once an import is done, the button will be blue-ed out and will not allow additional imports.
- After creating the test runs, one can click on the ‘Graph’ tab to see the graph. ( Duh ) See the next section to learn more about exploring the graph.
5.2 Graph exploration
In the ‘Graph’ tab, the graph responds to the settings that are presented to the left. In Full Window view, the same settings pop-up upon clicking the cogwheel button. The settings are discussed below.
Upon creation of the test to which the graph belongs, all settings are initiated so that nothing will show. After that, changes in settings will be stored. Some settings may cause long wait times, which may lead to surprises when re-visiting a graph.
All settings can be changed at will, even though some changes ( like a negative X axis start ) will be auto corrected.
Please note: to copy an image of the graph, right-click outside the actual graph area but inside the graph’s overall edge ( for example the title area ), and select ‘Copy’.
Here follow descriptions of the settings.
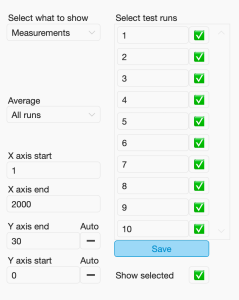
5.2.A Select what to show
There are two options to choose from:
- Measurements
Speaks for itself. Please note that the design is meant to visualize only whole numbers ( 0, 1, 2, … ). It most likely works with negative numbers as well, and perhaps it works also with other real numbers.
- Window average
The window average, as implemented here, is an average over a range of n consecutive values. The first window gives the average over 1 to n, the second over n + 1 to 2n, and so on. The window average is rounded of to the nearest whole number. It works per test run, not across test runs ( see the next sub-section ).
When ‘Window average’ is selected a dialogue shows up to ask for the window size, i.e. n. After entering a value, the solution determines how many windows fit in the current X axis settings for measurements. If necessary, it will round off upwards. It will then replace the measurement settings with settings for windows. This way, the windows shown will cover the same range of measurements that were shown before, or more.
Unfortunately, the current version has a bug whereby the recalculation fails and the X axis will cover only window 1. I have not yet been able to replicate this behavior with the script debugger on, so it is difficult to see what goes wrong.
After the initial setting, a new field pops up where the window size can be entered. If a new window size is entered, then the X axis values are not recalculated.
Do note that high window size settings and high X axis ranges can lead to long calculation times.
Switching back from ‘Window average’ to ‘Measurements’ leads to a reversal of this process and works correctly in my tests.
5.2.B Average
The average is calculated per measurement over multiple test runs ( in contrast to window averages which are calculated per test runs over multiple measurements ). ‘Average’ setting has three possibilities
- Do not show
- All runs
The average will be calculated over all test runs in the current test, independent of whether they are selected or not.
- Selected runs
The average will be calculated for the selected test runs.
See below for selecting test runs. In combination with the ‘Show selected’ setting ( also explained below ), either the average can be shown in addition to the selected test runs or instead of them.
Calculating the average between many selected test runs and over high X axis ranges can cause delays.
5.2.C X axis settings
These two settings determine which measurements from each test run are shown. They can be set manually and should range between 1 and the maximum value count, which can be found in the ‘Test runs’ tab.
Above the graph is a button bar that allows quickly changing the X axis settings. Buttons that are ‘blue-ed’ out, will have no effect because they logically can not have an effect.
In addition, the graph itself has invisible buttons which allow quickly zooming into a part of the current X axis. The buttons will show as blue blocks upon hoovering, as illustrated in the image at the start of this page.
5.2.D Y axis settings
The Y axis settings can be set manually, or to ‘Auto’.
When ‘Auto’ is switched on, the solution will calculate the maximum of what will be shown, and add 10 percent. It sounds handy, but if window averages and/or test run averages and/or high X axis ranges are involved, the auto setting can cause significant delays.
By default ‘Auto’ is switched off to prevent unexpected delays. Better start setting the Y axis manually by taking into account the minimum and maximum values of the entire test. Then zoom in manually depending on the graph that is presented.
Note that once a graph is calculated, manually changing the Y axis settings are reflected relatively fast. It seems that FileMaker keeps the displayed data into memory once it is loaded.
5.2.E Select test runs
Selecting test runs influences the graph in multiple ways. The foremost one is which test runs will be shown. However, depending on the ‘Average’ setting discussed above, it may also influence which average is depicted.
Save button
Whereas all other settings have immediate effect on the graph, selecting test runs has to be confirmed through the ‘Save’ button. The reason for this is that with some settings, calculating a graph may take some time. When one wants to make a different selection in such situations, each click on a check box would result in recalculation, which leads to unnecessary waiting.
If the ‘Save’ button is blue-ed out, saving is not needed, because the selection is the same as the last saved one.
Selecting more than 10 test runs
Once can select more test runs than the 10 that the graph can show. This will influence the calculation of the average when the ‘Average’ setting is set to ‘Selected runs’. However, the graph will only show the first ten.
Show selected
Notice that the ‘Show selected’ setting also influences whether the selected test runs will be shown.
5.2.F Show selected
‘Show selected’ decides whether the selected ( and saved ) test runs will be shown in the graph. Normally, it is switched on. However, when one wants to only see the average without being distracted by the potential chaos of the individual test runs, one can switch this off. It will also reduce calculation times when relatively many test runs are selected.
5.3 Navigating between tests
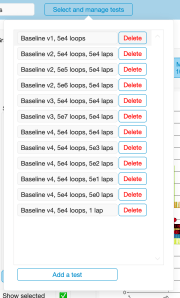
Once a test is created, it will/can appear in the list of tests that pops open upon clicking the ‘Select and manage tests’ button. Whether it appears depends on whether it is part of the current found set.
Upon opening the file as it is downloaded, the Status Toolbar is not showing, but one can choose to show it and use FM’s built in navigation and search options.
The current version unfortunately creates an empty found set before creating a new test, which means that only the new test will appear in the list. Use FM’s shortcuts, menu or Status Toolbar to show all tests or to find a selection.
6 Feedback and questions
Hopefully you find the solution useful and easy to use. So far, I have designed it for my own use. This is only for lack of other opinions. Please do provide me with feedback if and when you are using this solution. I will listen carefully, because nothing improves a design like feedback from users and other developers.
You can provide feedback either through comments below or through direct messages to frank_drv@icloud.com.
7 Disclaimer
This application is built with a lot of care, is under development, and is provided ‘as is’.
8 Copyright
I claim the intellectual rights to Speed Test Viewer. I also allow anybody to use and copy it for their own use, including commercial use, provided I am credited by name, company name and websites:
Frank van der Most, RubberBootsData
https://frankvandermost.com
https://rubberbootsdata.com
Frank van der Most, 19 November 2025
