In this text, I will explain a common data problem that the sea turtle researchers at Osa Conservation asked me to solve. The solution is a so-called data blending tool to not just stitch data from multiple tables together, but also to address differences in data formatting, and to keep track and automatically document all modifications in metadata output files.
What is the problem?
In short, the problem is that one may want to bring multiple data tables together that are similarly but differently structured and that have data differently formatted. Data blending is the activity of solving such a problem.
The problem can easily occur in multi-year projects where data is handed over from one team or person to the next – not uncommon in long-running nature conservation projects. Each new team may make small changes, and subsequent changes then add up to problematic differences between the first and the last versions.
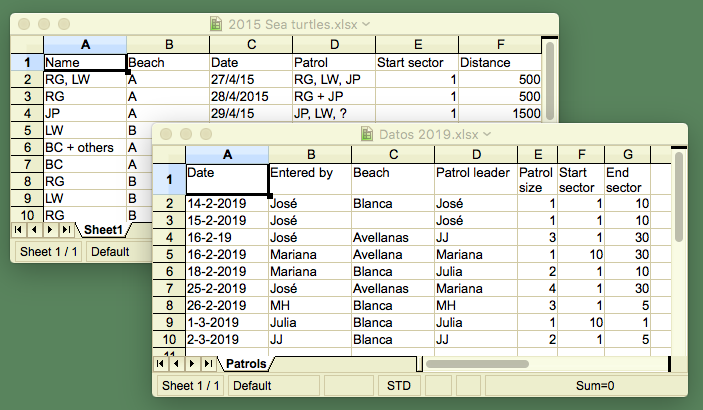
The sting of the issue sits in the part ‘differently structured’. This could mean a number of things, including ( but certainly not limited to ) the following. Some are illustrated in the image above.
- It could mean that the order of the columns is different. Someone may have changed it because it was handier at some point.
- Data could be divided over multiple tables in different ways.
- It could mean that the names of the columns do not match between different files anymore. For example, ‘date’ becomes ‘date of purchase’.
- It could mean that the format of the data differs. For programmers, a notorious case is how dates can be differently formatted.
- It could mean that even though the names of the columns are the same, the meaning is different. For example ‘date’ could mean the date of an event in one file, and date on which the data was entered in another. This one is particularly difficult to spot if one only has the data but no description ( no metadata ) of it.
- Another problem could be that the unit of what is measured changes. Say from meters to yards, from Deutschmark to Euro, and so on. Yes, it should be mentioned in the column header, but is it?
- Similarly, coding systems may change. Instead of the first names of the researchers, acronyms may be used. Or instead of yes/no, it could be yes/no/maybe/no-data.
- Finally, it could be that data is entered outside the area where one would expect it, meaning in columns without a heading or in rows far below where a block of rows ends. This could be accidental scrap data or intentional additions of for example summary data.
Some of these problems can not be solved unless one has additional information. If the header of a column only says ‘Date’ and one needs to know if that is, say, the date of departure or the date of arrival, the data itself is not likely to tell. In the remainder of this text, those types of problems are ignored because a blending tool will not provide the answer. One will have to do historical research or interview someone, or so.
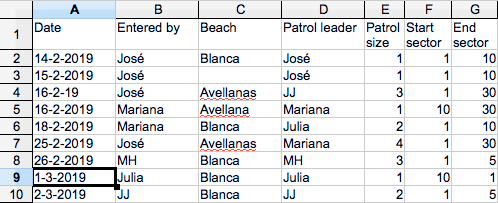
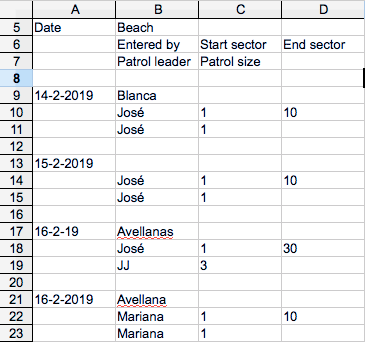
Another type of challenge that this blending tool can not solve is that the table is not actually a table, but a spreadsheet designed as a repetition of forms. See the two images below that explain the difference.
So, setting aside those types of issues, each of the remaining ones from the list is not that difficult to solve. But of course, if left unchecked, changes may accumulate over time so that the first version of a file would not recognize the last.
Can this problem be solved manually?
How would one solve this if one only had manual labor, the spreadsheet software and the files? Well, it is possible, but it may not be very effective or efficient, as will be discussed in this section.
Each of the problems listed above has its own particular solution. For example, if the order of the columns is not the same, one needs to reorder them ( by dragging or copy-pasting ) in a uniform way before copy-pasting them all into one file. If the formatting of a date differs between rows or tables, they need to be harmonized with the formatting and calculation functions that are available in the spreadsheet software. And so on. Every problem needs to be addressed one-by-one. In my view, with patience, systematic checking and conscientious work, this way, one can disentangle the biggest ‘data spaghetti’ imaginable.
However, this has a couple of downsides. First of all, one needs to have the right mindset for this kind of work. Patience is not in everybody’s dictionary. Systematic working is also not always a given and precise working is also not easy. Basically, it is a tedious job.
Secondly, if the set of files, or the number of columns in them is large, then it will take a lot of tedious work. Even if one has the right mindset for it, one will have problems keeping up the required level of focus in the face of work interruptions, potential bad nights of sleep, work pressure and so on. Was the format of column BC in file 29 checked? Or did one stop at BE before going for a lunch break?
Thirdly, the details of the manual labor go lost in history, unless one has made really good notes. If one is working in science, a reviewer may want to see those notes, so they need to be fool-proof readable. One may have to do individual data corrections, which are virtually impossible to trace. And what to do if one realizes later on the corrections need to be corrected?
Arguably, much of the cloud-based software can keep track of changes, but for how long will they provide the service, and for how long will one keep the files in the cloud?
So, yes, in theory the problem can be solved manually, but in practice it may be a different story. Since at the time, in 2020, I could not find an existing software tool, I decided to build one. Now, about three years later, I know that the word to look for is ‘data blending’, and that there are tools available that do a similar thing, but perhaps not in the same no-code way and not with the same documentation facilities.
Table Stitcher. How does it blend data?
The Table Stitcher blending tool helps solving this problem with the following strategy for data blending
1. All changes to the data are traceable, reviewable, and adaptable.
Instead of altering the data directly, the Table Stitcher will generate and export a changed version of the data. Basically, one first imports all problematic data and then specifies and exports a revision with a uniform structure and formatting. All changes are not made to the data itself, but administered as instructions next to the data. This way one can always retrieve how the final result was generated.
An added benefit is that if the end result is not good enough, one can simply change the instructions and generate a new version of the final result. After all, almost nothing is really final, not in life, not in databases.
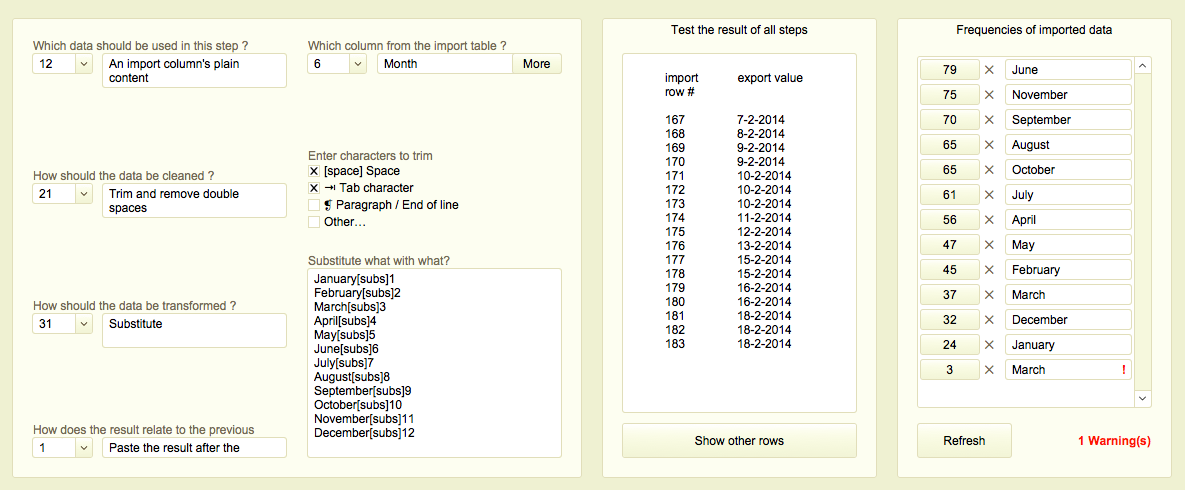
The image below shows the interface for this step. Notice that no programming is required.
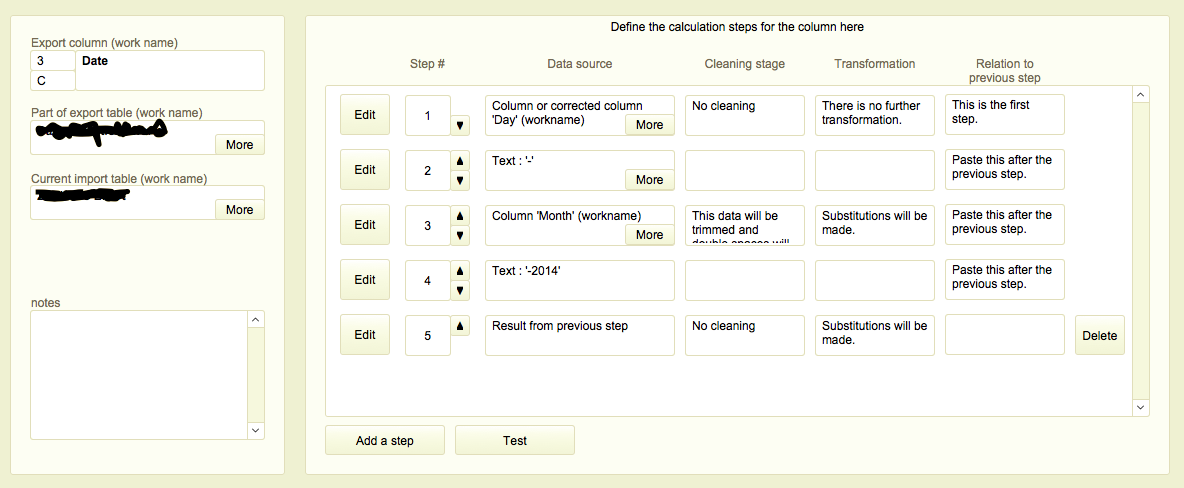
The Table Stitcher also allows manual cell changes and applies the same approach : document the difference and generate a new version.
2. Integrated data-cleaning and formatting
The tool also provides the possibility to change the formatting or correct regular mistakes in the data. For example, a column may contain dates in different formats, or someone often miss-spells a particular name. With a quick-test facility one can preview the result of the changed formatting and manual corrections.
3. Generating multiple new tables
Depending on the data and user wishes, the blended data can be merged together into one or more separate tables.
4. Documentation, documentation, documentation
The Table Stitcher offers ample opportunity to add notes and meta-data, on both the original and the export table(s) and columns. This will help reporting on the blending process to reviewers, successors, or oneself a couple of years later.
Interested?
Contact Rubber Boots Data via frank_drv@icloud.com
.
This is a re-written version of an earlier post from 2020.
